Illustration
Bone marrow organoids (3D render, 2021)
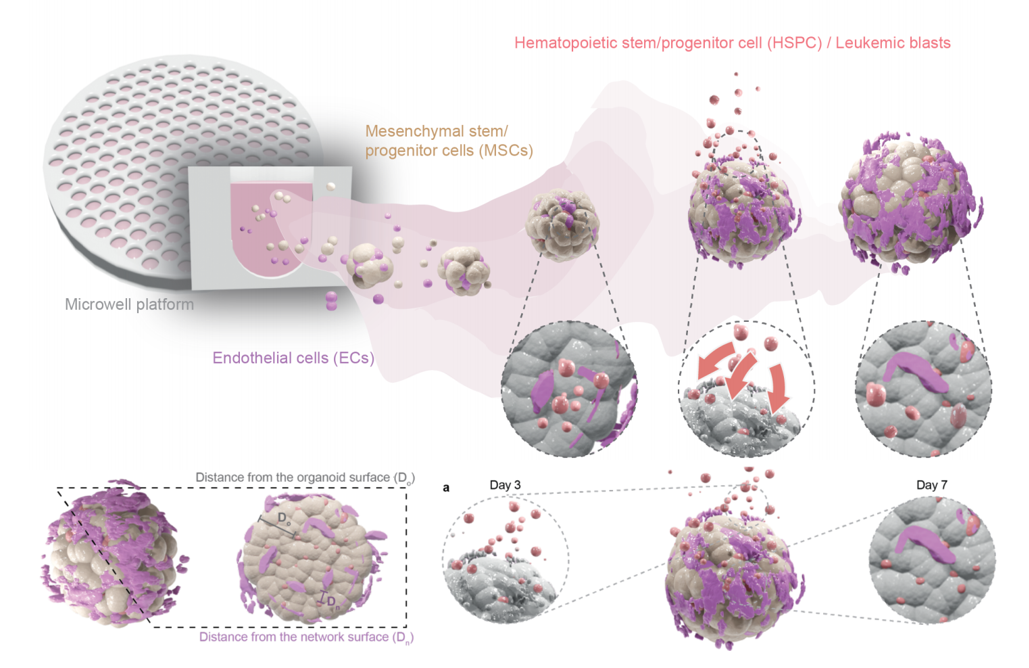
This work was commissioned by Sonja Giger, a former PhD student in the lab, which needed figures to illustrate her organoid research. Sonja generates human bone marrow organoids by aggregation of Mesenchymal Stem Cells (beige), and then incorporates Endothelial Cells (purple) within them to mimic the vascular compartment of the bone marrow niche. Over time, these endothelial cells come together to form a branched network throughout the organoid. These aggregates can then be used e.g. as an assay for the homing capacity of healthy or diseased blood cells (red), which she would then find within the core of the organoids.
The illustration process was mainly done on Blender, and combines 3D modelled structures (cells and aggregates, multiwell plate, etc..) with real-world data collected by Sonja. Indeed, the 3D model of the endothelial network that forms over time (purple network in the figures), comes directly from volume microscopy data collected from real organoids. The composition of floating cells and cell aggregates was instead generated by a combination of particle emitter, flow constraints, and gravity attractors from scratch.
Read more about the science over here
Mouse embryos and microfluidics (2D illustration, digital airbrush; 2021)
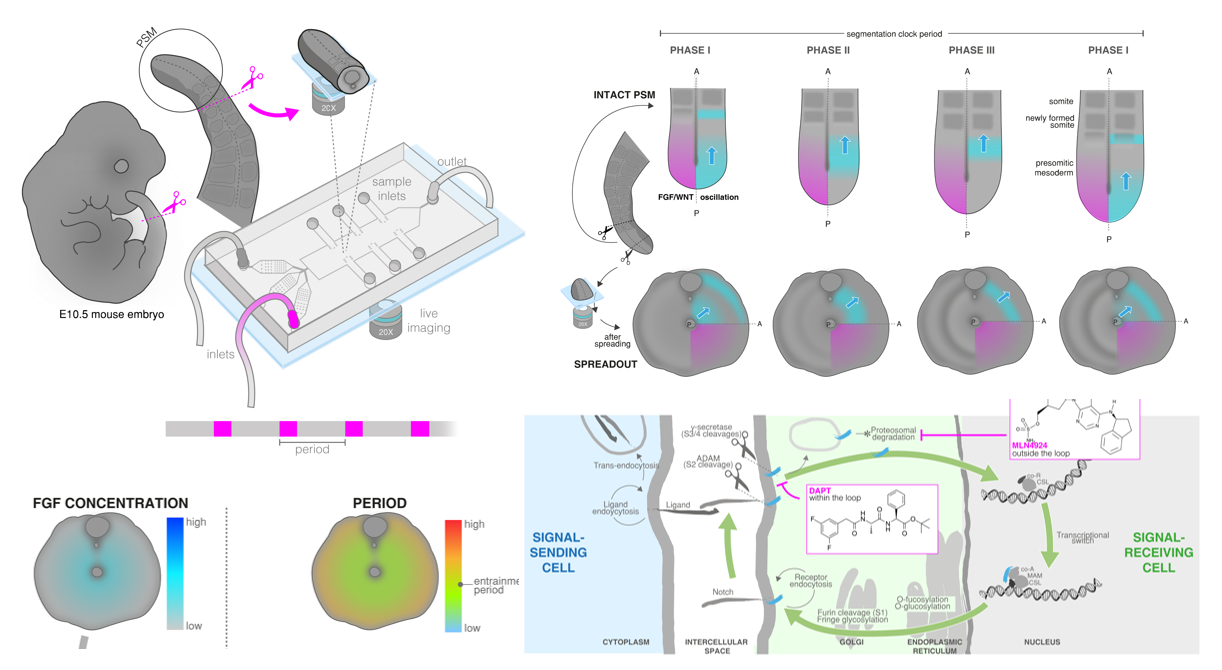
Above is a collection of some of the figures I designed and illustrated in collaboration with Paul Gerald Layague Sanchez, for his PhD thesis. Paul works on fundamental principles of eintrainment and synchronisation, and found that these very principles apply to living systems (specifically, the process through which the mouse embryo forms its somites, regular blocks of tissue that will give rise to the vertebrae). By putting tails (or in vitro models of them) into a microfluidic device, Paul could show he could use the oscillatory delivery of small molecules to control (slow-down and speed-up, predictably) the speed of the internal oscillations of the embryo.
These illustrations were all done in a vector graphics editor, using soft layering of colors to give the illusion of volume (e.g. for the embryo), and to illustrate the ridges of the segmenting tail explants. Other elements were drawn in isometric style (see the microfluidics device). Working on this project was an intense and extremely enriching collaboration trying to bring to the page fundamental concepts of physics as they applied to a biological system.
Read more about the science over here
Mechanical imputs to development (3D rendering and 2D “cartoon”; 2019)
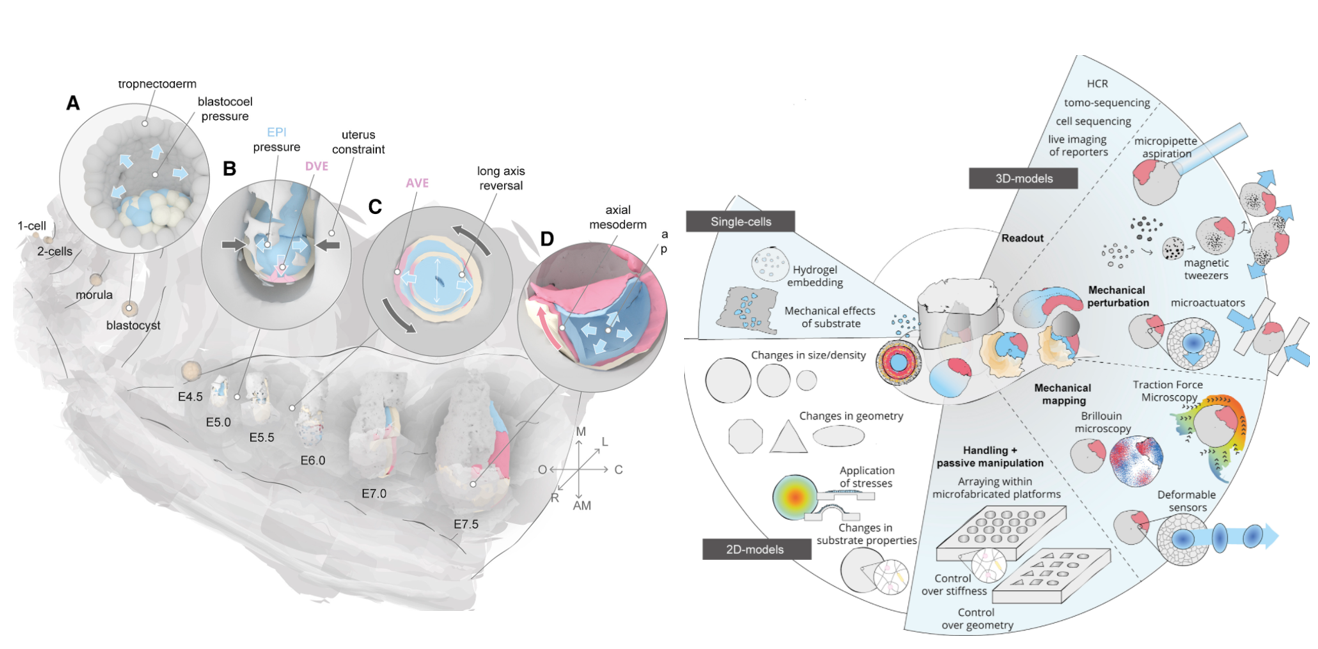
One of the very first set of illustrations I drew during my PhD, for a review bringing together knowns and unknowns of the biomechanical inputs of mouse development, and the potential held by in vitro embryonic systems to test these questions experimentally. The illustration on the left (timeline of mouse development as it implants in the uterus) combined elements of 2D illustration (mostly, the background) with rendered 3D models of mouse embryos at different stages of development (a more detailed writeup on the history and background of these models is available here). At the end, the setup resembled that of a puppet stage, with the 3D embryonic models floating in front of (and aligned with) a painted 2D background. The illustration on the right (experimental applications of in vitro embryonic models for the study of mechanobiology) was instead an early experimentation with a more “cartoonish” style, marked by stylised 2D elements bound by dark outlines.
Read more about the science over here
Endoderm emergence in the early mouse embryo (3D rendering from volume data; 2020)
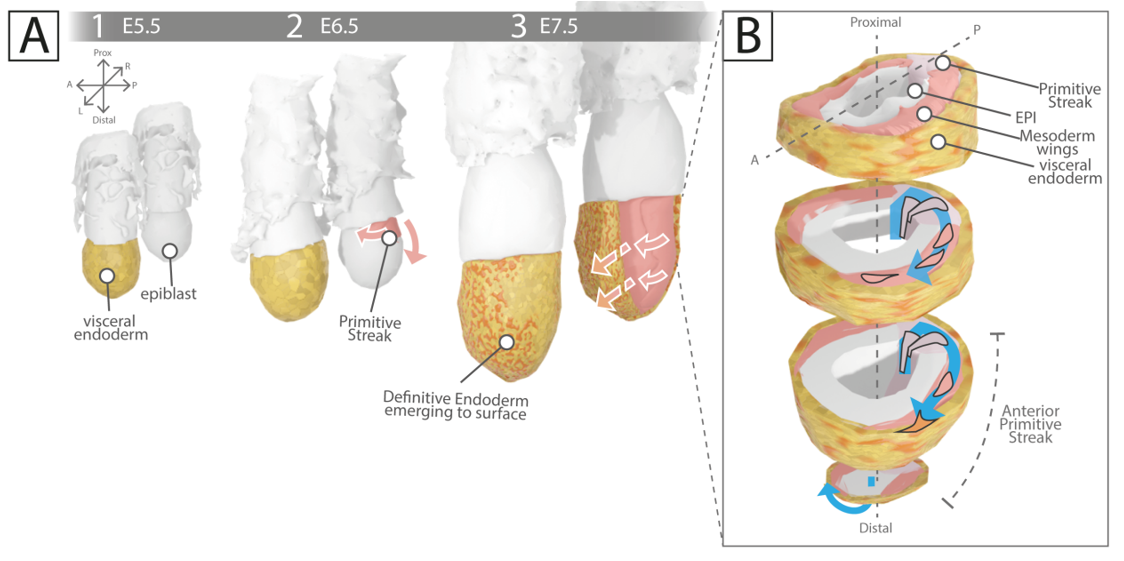
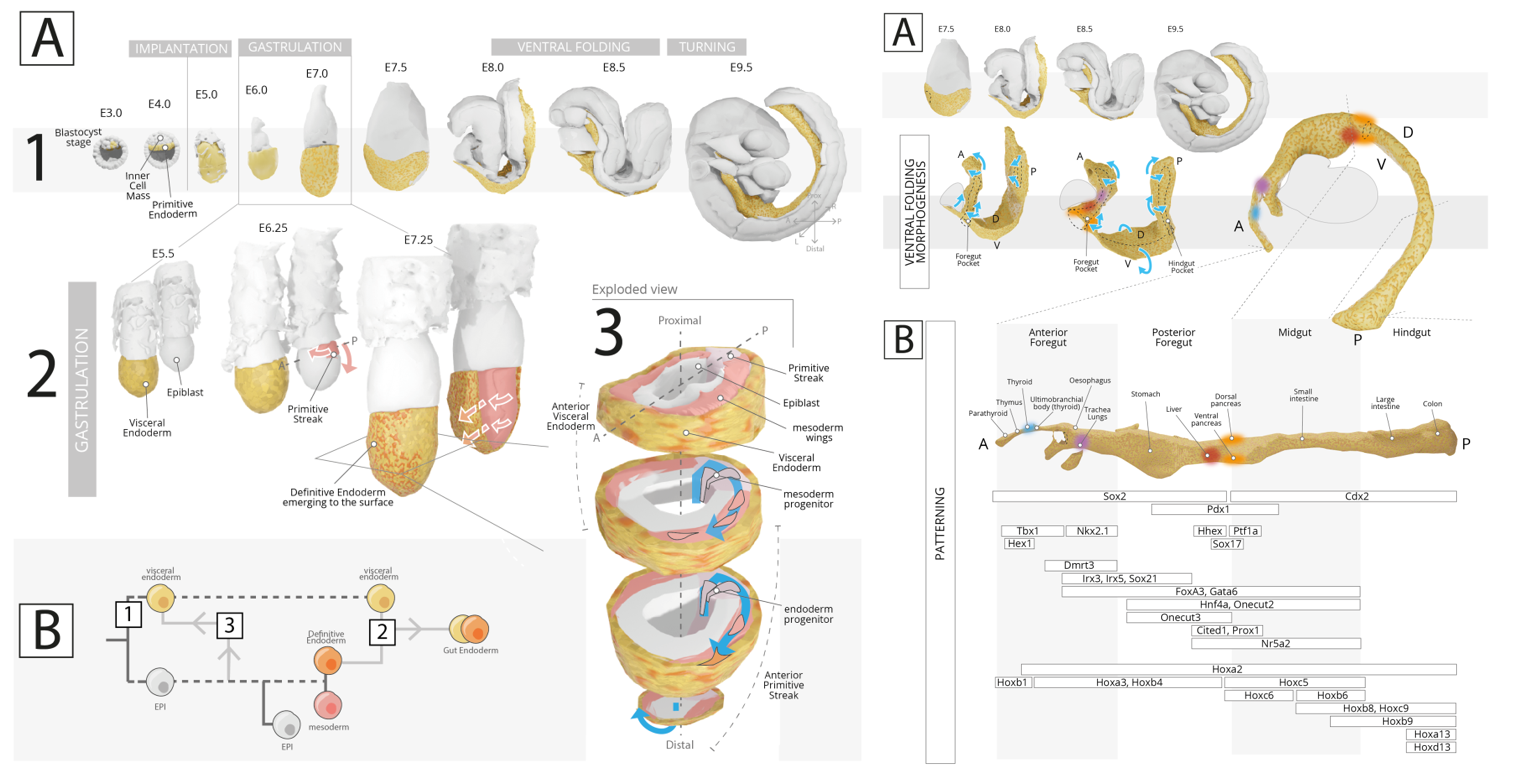
Illustrations I did for one of my own publications and for my thesis! A summary of the main step of gut endoderm development as endoderm cells first emerge within the primitive streak (pink in the image), circumnavigate the surface of the embryo proper (white) and intercalate in the outer layer of (extraembryonic) visceral endoderm (yellow). The path of specific mesoderm (red) or endoderm (orange) cells is stylised in the insight on the right.
This illustration was heavily based on the use of 3D rendering software and embryonic models as I elaborated upon in this publication. Specifically, the need to show the changing cellular composition of the outer epithelial layer of the embryo (visceral endoderm first, then with intercalated embryonic endoderm cells) allowed me to experiment with more complex material editing tasks and more complex node setups in the software. Slicing of the 3D models to create the “exploded view” shown in the inset at the right (and inspired by the beautiful hand drawings of Rosa Beddington) was done by applying simple boolean modifiers on the model geometries.
Read more about the research over here and here
Harnessing self-organisation to build better organoids (2D illustration, isometric; 2019)
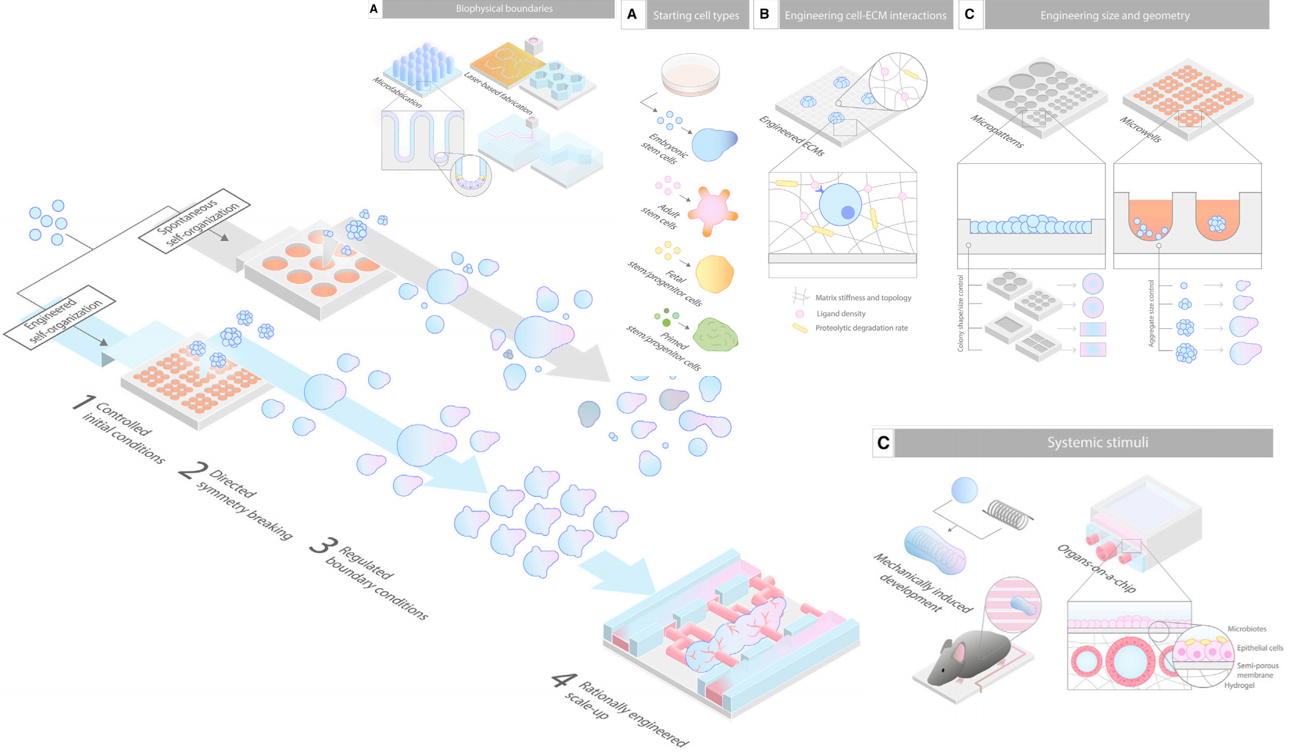
When asked to illustrate bioengineering topics for a review on the latest on organoid biotechnology, especially as they relate to microfluidics chips, micropatterns, micropatterned structures and devices, my mind immediately went to an illustration style that could look modern and technological. A departure from the much more organic styles I usually find myself having to illustrate. Drawing in isometric style (see illustrations above) is sometimes challenging but a very fun activity that almost feels like lego construction and is a very interesting style to experiment in.
In practical terms, these illustrations (as all the other ones in the review) were all done in a vector graphics editor, with the help of a simple isometric guiding grid in the background layer.
Read the review over here
An automated DIY system for dynamic stem cell and organoid culture. (2D illustration, isometric; 2022)
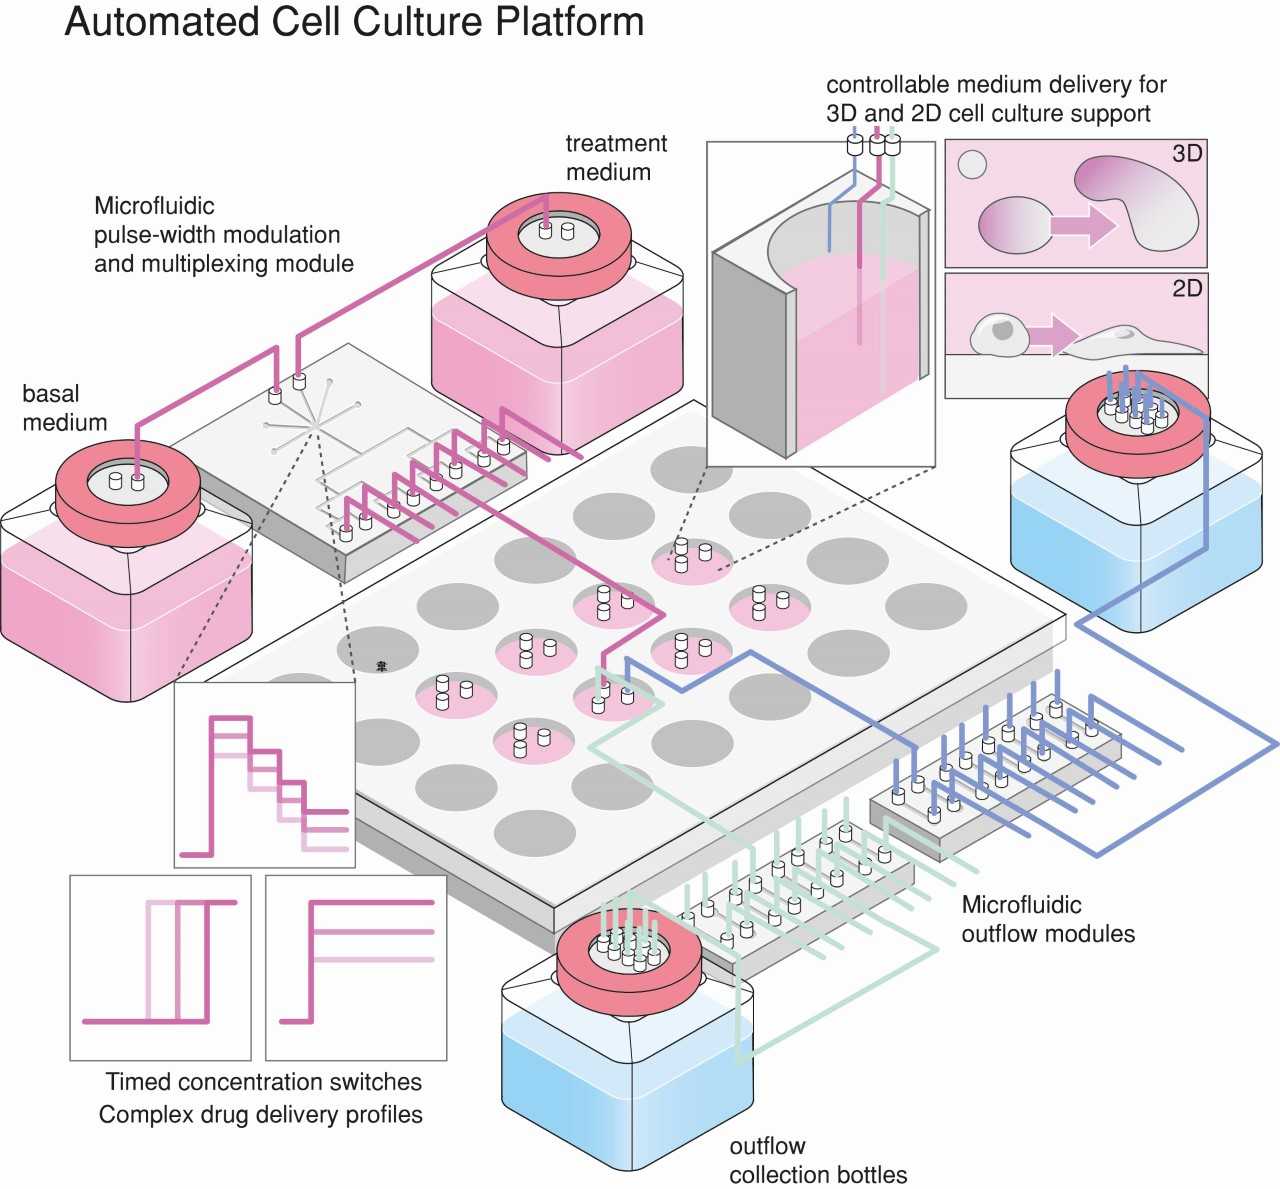
Another, more recent, illustration in isometric style. This time to summarise the set up of a microfluidics-based automated setup to expose cells and organoids to precise and dynamic concentrations of small molecules without the need of user intervention. This is an illustration that I was very happy to do for the graphical abstract of my dear colleague Julia Tischler at EPFL, who led the research. As all my other isometric illustration, this one was done in a vector graphics editor, with the help of a simple isometric guiding grid in the background layer.
Read about the research and the actual device over here
A protocol for mitochnodrial ribosome profiling (simple 2D sketch, 2021)
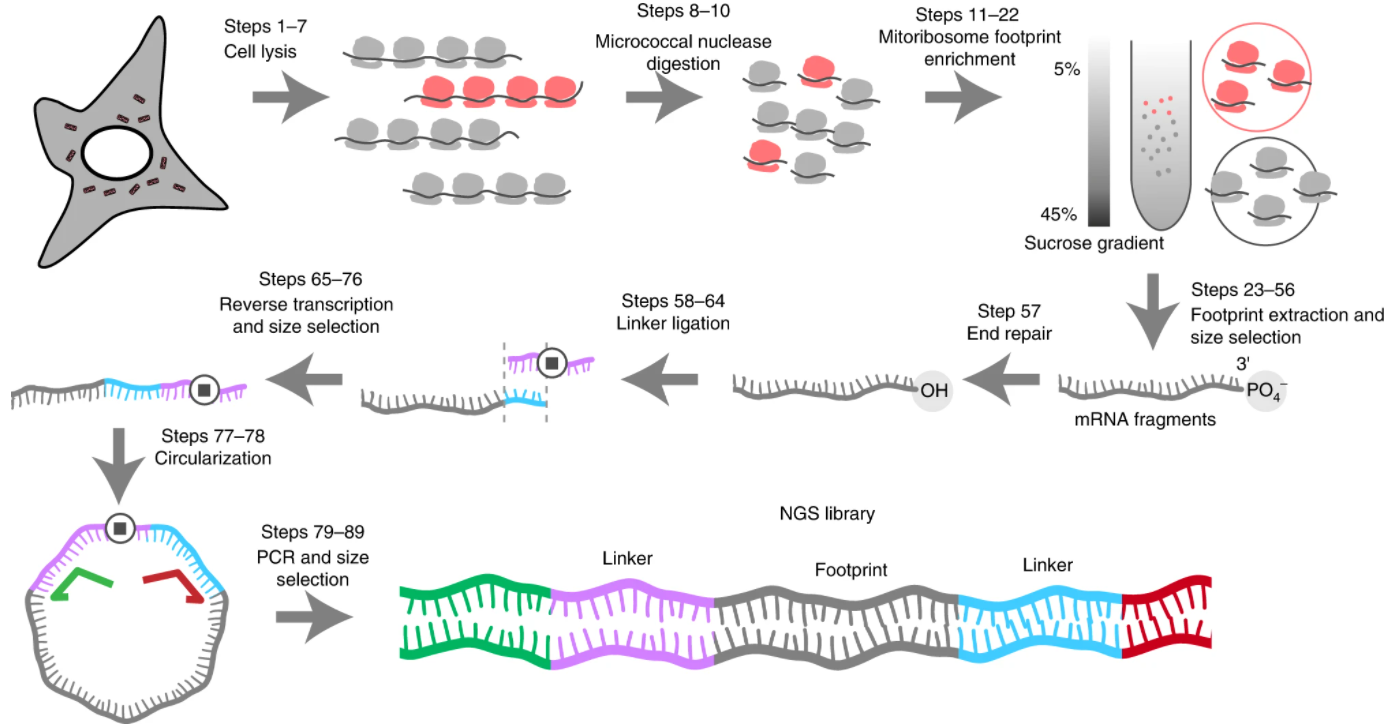
A quick and fun illustration done for Sophia Li, a postdoc in my lab. Before joining our lab Sophia developed a method to monitor ribosomal activity on the messenger RNA they are translating, and she collaborated with me to draw up a visual summary of the experimental details of the procedure.
Read more about the method over here